
如何调整R语言ggplot2绘图的legend细节设置呢?
Data
ToothGrowth data is used in the examples below :
## Convert the variable dose from numeric to factor variable
ToothGrowth$dose <- as.factor(ToothGrowth$dose)
head(ToothGrowth)
###    len supp dose
### 1  4.2   VC  0.5
### 2 11.5   VC  0.5
### 3  7.3   VC  0.5
### 4  5.8   VC  0.5
### 5  6.4   VC  0.5
### 6 10.0   VC  0.5
Make sure that the variable dose is converted as a factor variable using the above R script.
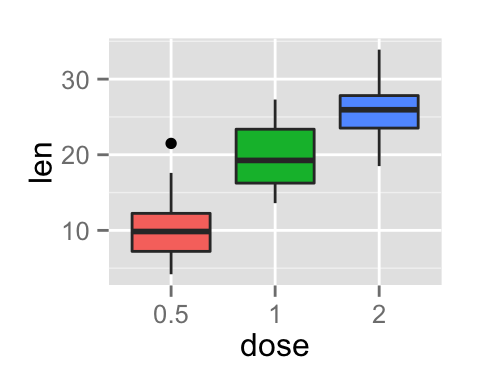
Example of plot
library(ggplot2)
p <- ggplot(ToothGrowth, aes(x=dose, y=len, fill=dose)) +
  geom_boxplot()
p
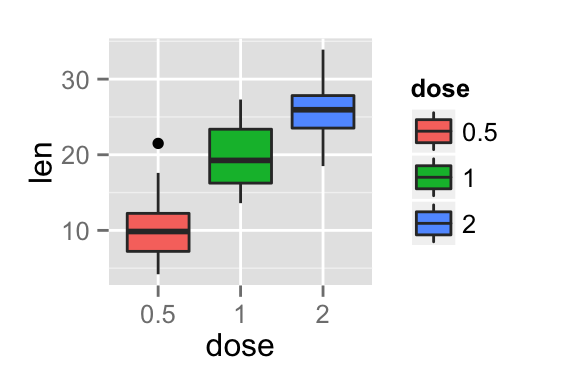
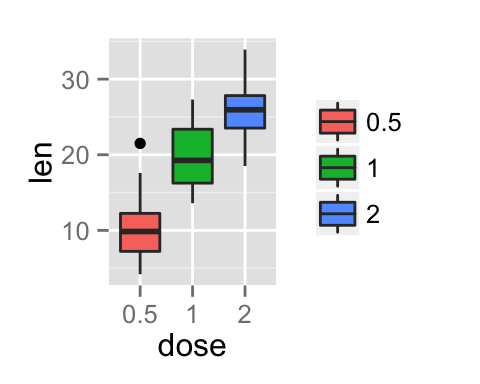
Change the legend position
The position of the legend can be changed using the function theme() as follow :
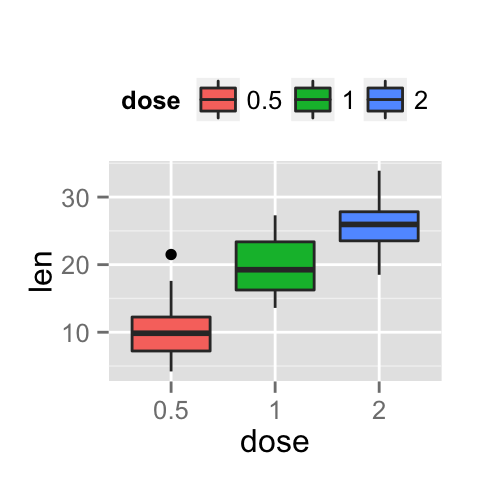
p + theme(legend.position="top")
p + theme(legend.position="bottom")
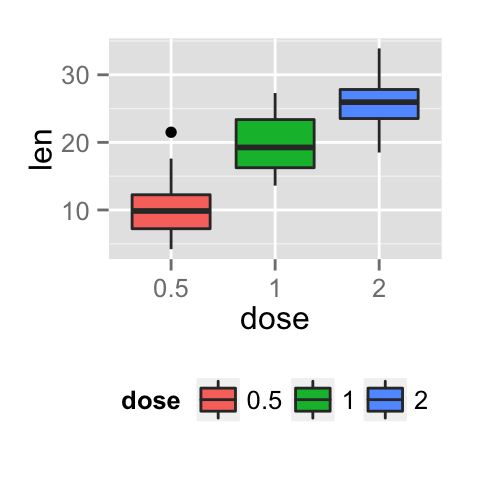
The allowed values for the arguments legend.position are : “left”,“top”, “right”, “bottom”.
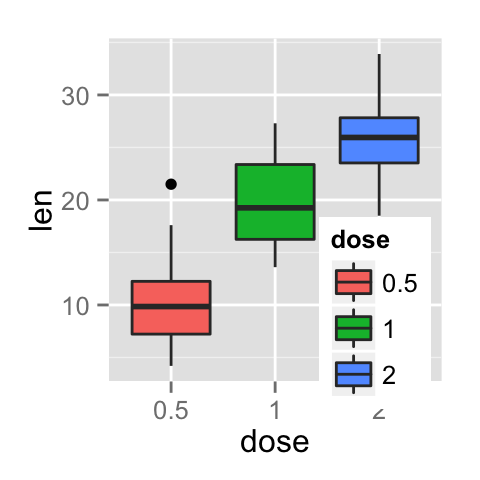
Note that, the argument legend.position can be also a numeric vector c(x,y). In this case it is possible to position the legend inside the plotting area. x and y are the coordinates of the legend box. Their values should be between 0 and 1. c(0,0) corresponds to the “bottom left” and c(1,1) corresponds to the “top right” position.
p + theme(legend.position = c(0.8, 0.2))
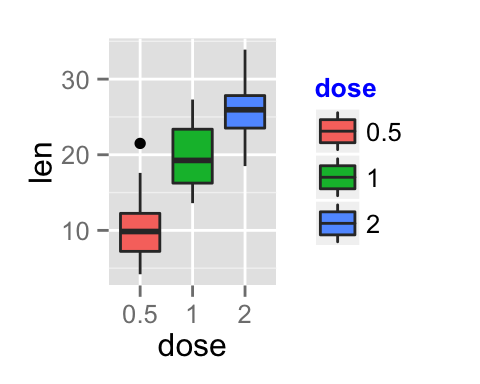
Change the legend title and text font styles
## legend title
p + theme(legend.title = element_text(colour="blue", size=10,
face="bold"))
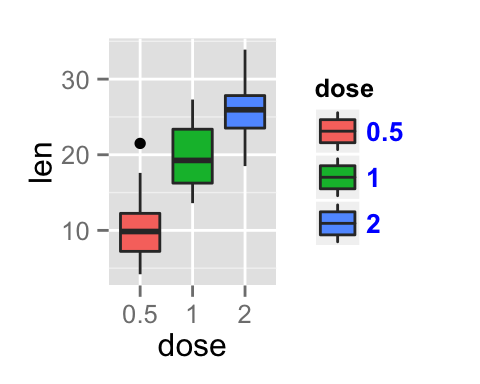
## legend labels
p + theme(legend.text = element_text(colour="blue", size=10,
face="bold"))
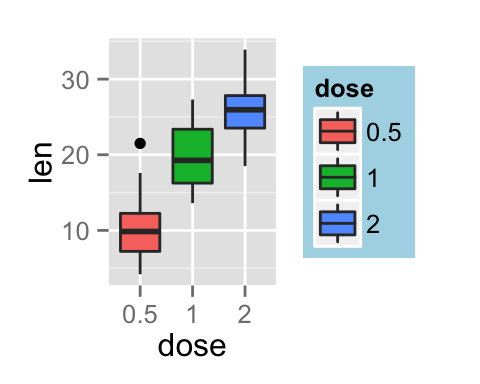
Change the background color of the legend box
## legend box background color
p + theme(legend.background = element_rect(fill="lightblue",
size=0.5, linetype="solid"))
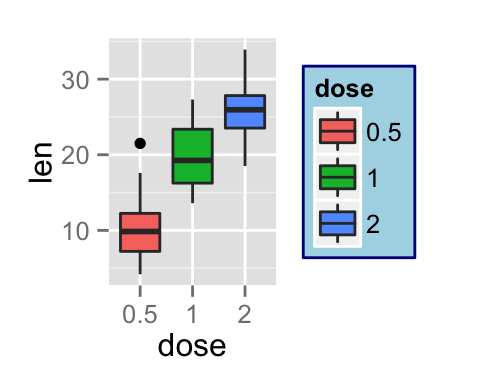
p + theme(legend.background = element_rect(fill="lightblue",
size=0.5, linetype="solid",
colour ="darkblue"))
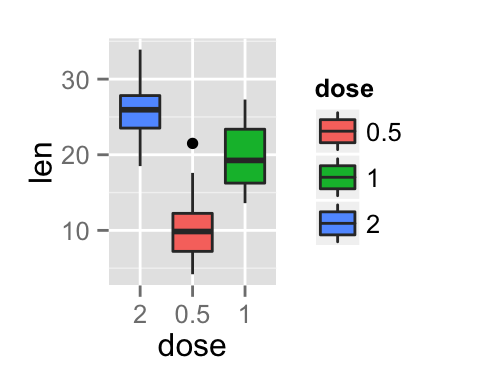
Change the order of legend items
To change the order of items to “2”, “0.5”, “1” :
p + scale_x_discrete(limits=c("2", "0.5", "1"))
Remove the plot legend
## Remove only the legend title
p + theme(legend.title = element_blank())
## Remove the plot legend
p + theme(legend.position='none')
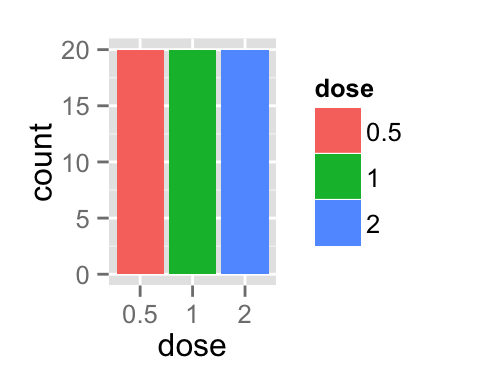
Remove slashes in the legend of a bar plot
## Default plot
ggplot(data=ToothGrowth, aes(x=dose, fill=dose)) + geom_bar()
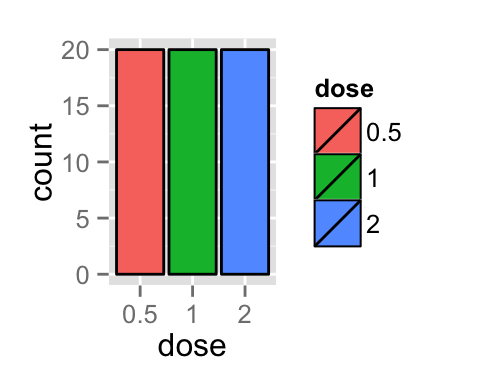
## Change bar plot border color,
## but slashes are added in the legend
ggplot(data=ToothGrowth, aes(x=dose, fill=dose)) +
geom_bar(colour="black")
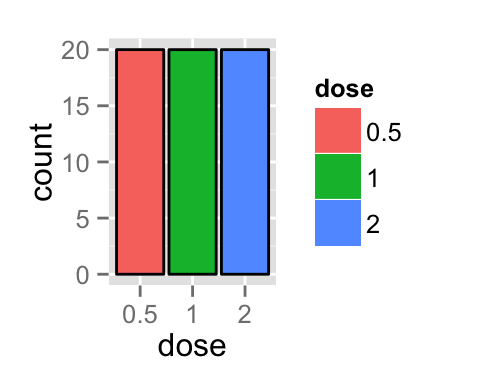
## Hide the slashes:
#1. plot the bars with no border color,
#2. plot the bars again with border color, but with a blank legend.
ggplot(data=ToothGrowth, aes(x=dose, fill=dose))+
geom_bar() +
geom_bar(colour="black", show_guide=FALSE)
guides() : set or remove the legend for a specific aesthetic
It’s possible to use the function guides() to set or remove the legend of a particular aesthetic(fill, color, size, shape, etc).
mtcars data sets are used :
## Prepare the data : convert cyl and gear to factor variables
mtcars$cyl<-as.factor(mtcars$cyl)
mtcars$gear <- as.factor(mtcars$gear)
head(mtcars)
###                    mpg cyl disp  hp drat    wt  qsec vs am gear carb
### Mazda RX4         21.0   6  160 110 3.90 2.620 16.46  0  1    4    4
### Mazda RX4 Wag     21.0   6  160 110 3.90 2.875 17.02  0  1    4    4
### Datsun 710        22.8   4  108  93 3.85 2.320 18.61  1  1    4    1
### Hornet 4 Drive    21.4   6  258 110 3.08 3.215 19.44  1  0    3    1
### Hornet Sportabout 18.7   8  360 175 3.15 3.440 17.02  0  0    3    2
### Valiant           18.1   6  225 105 2.76 3.460 20.22  1  0    3    1
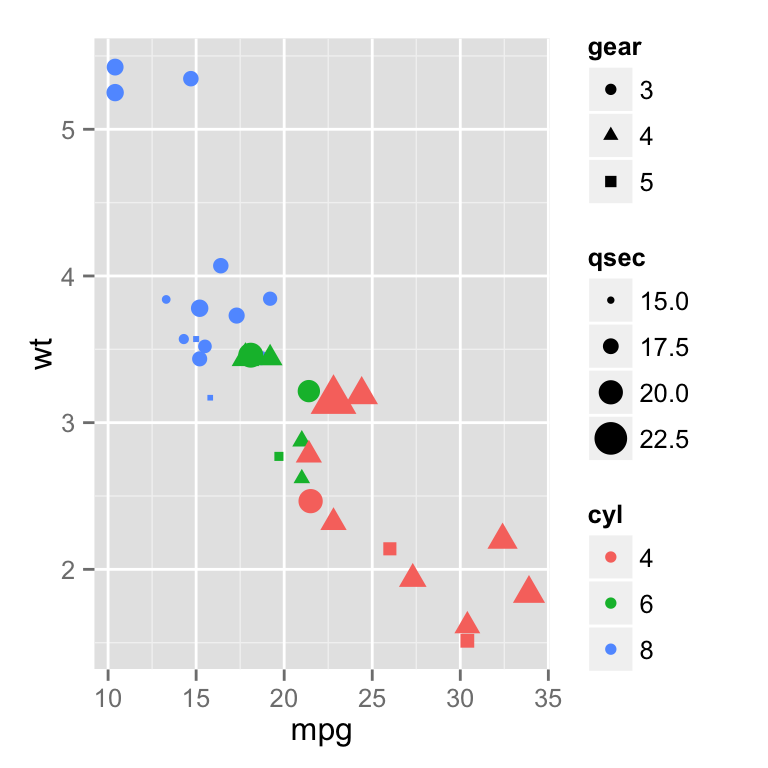
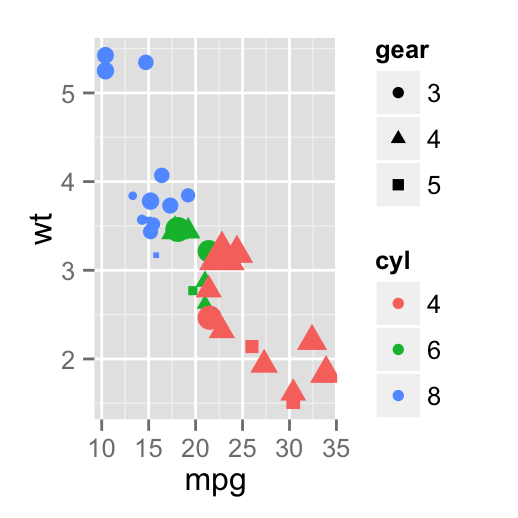
Default plot without guide specification
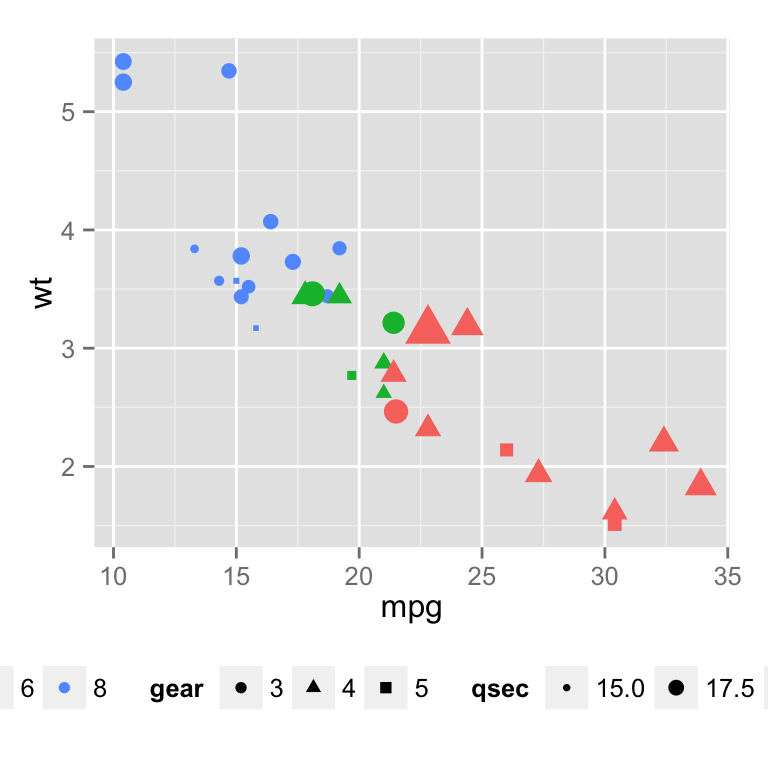
The R code below creates a scatter plot. The color and the shape of the points are determined by the factor variables cyl and gear, respectively. The size of the points are controlled by the variable qsec.
p <- ggplot(data = mtcars,
    aes(x=mpg, y=wt, color=cyl, size=qsec, shape=gear))+
    geom_point()
## Print the plot without guide specification
p
Change the legend position for multiple guides
## Change the legend position
p +theme(legend.position="bottom")
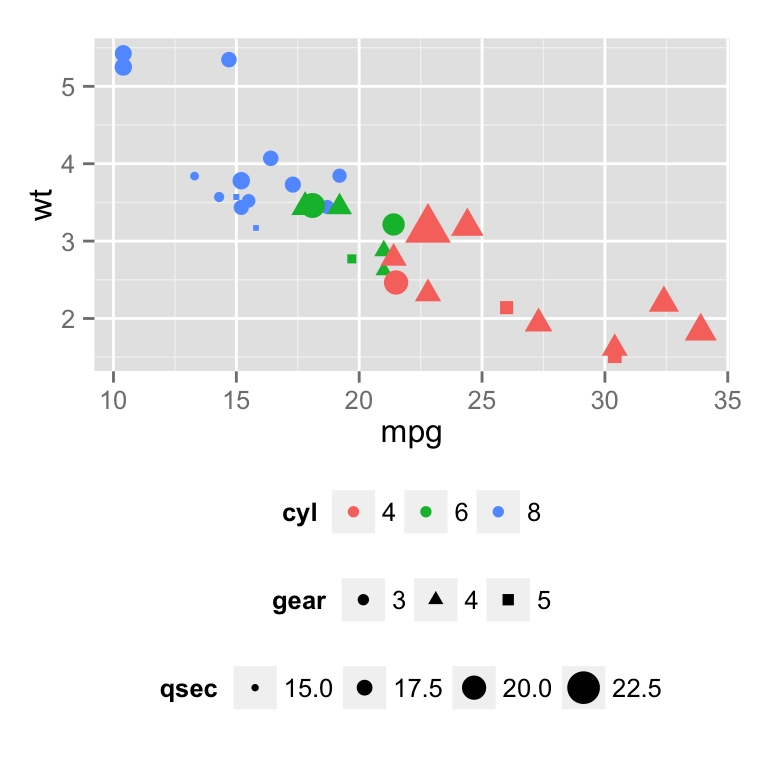
## Horizontal legend box
p +theme(legend.position="bottom", legend.box = "horizontal")
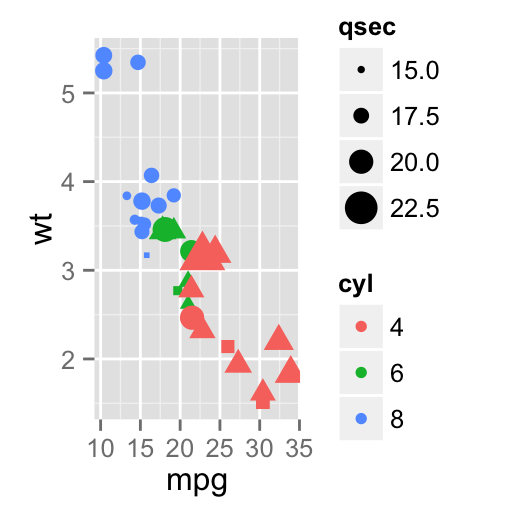
Change the order for multiple guides
The function guide_legend() is used :
p+guides(color = guide_legend(order=1),
         size = guide_legend(order=2),
         shape = guide_legend(order=3))

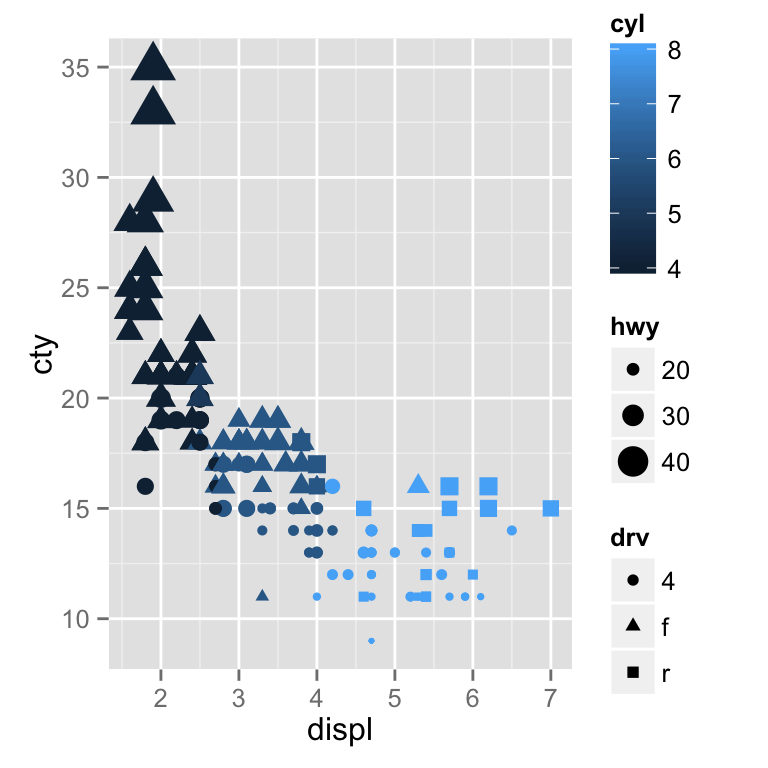
If a continuous color is used, the order of the color guide can be changed using the function guide_colourbar() :
qplot(data = mpg, x = displ, y = cty, size = hwy,
      colour = cyl, shape = drv) +
  guides(colour = guide_colourbar(order = 1),
         alpha = guide_legend(order = 2),
         size = guide_legend(order = 3))
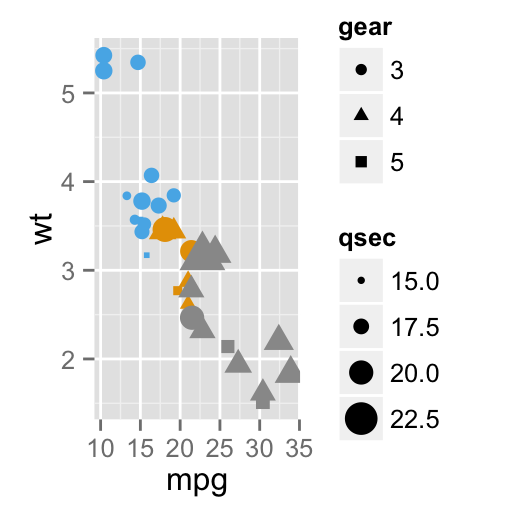
Remove a legend for a particular aesthetic
The R code below removes the legend for the aesthetics color and size :
p+guides(color = FALSE, size = FALSE)
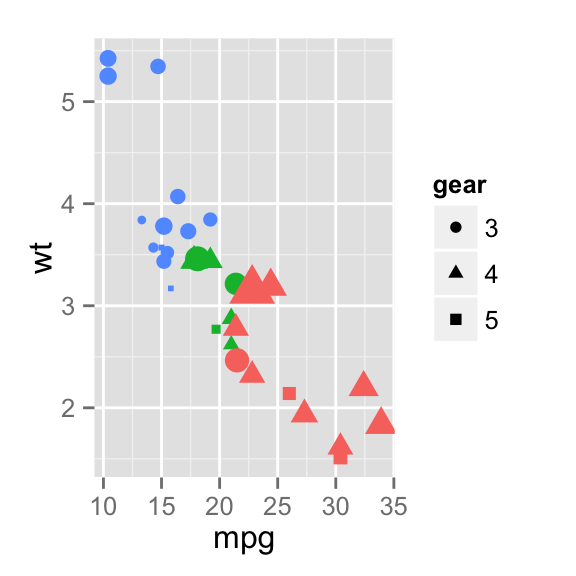
Removing a particular legend can be done also when using the functions scale_xx. In this case the argument guide is used as follow :
## Remove legend for the point shape
p+scale_shape(guide=FALSE)
## Remove legend for size
p +scale_size(guide=FALSE)
## Remove legend for color
p + scale_color_manual(values=c('#999999','#E69F00','#56B4E9'),
                       guide=FALSE)
Infos
This analysis has been performed using R software (ver. 3.1.0) and ggplot2 (ver. 1.0.0)