
前言
前面简单介绍了shinydashboard的标题栏,会发现标题栏是个鸡肋,只要掌握如何设置title即可。这一节简单介绍一下侧边栏。侧边栏(siderbar)主要起到导航作用,可以简单理解为输入栏,不同的输入栏(输入),主体(body)就呈现出不同内容(输出)。 侧边栏简介
侧边栏由菜单项(menu item)和输入项(inputs)组成。菜单项切换不同的界面,输入项决定界面呈现什么内容。简单理解为:侧边栏(siderbar)就是主体(body)的输入“参数”,用于切换不同的界面和改变界面呈现的内容。正如下面动态图所示:下方Author、Data、Summary、Plot、Plot1是菜单项,点击切换不同的界面;Number of Data、The Tpye of Plot、Variable、Choose CSV File等都是输入项,改变界面所呈现出的内容。
输入项
侧边栏的输入项主要改变界面所呈现的内容。下面简单介绍一些常见的输入项。以每一个完整的小栗子讲解怎么使用每一个输入项。
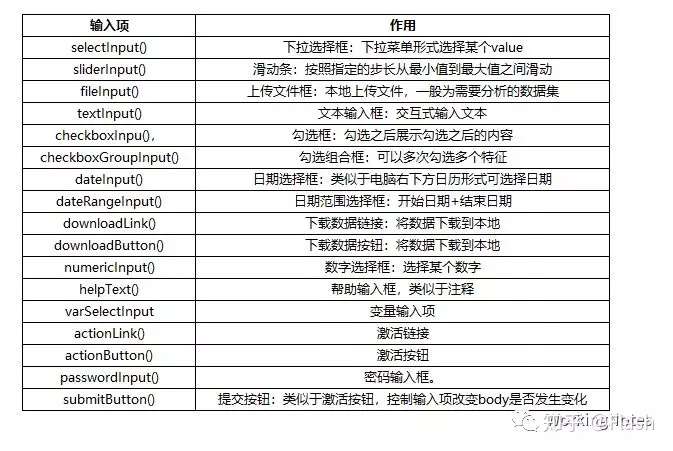
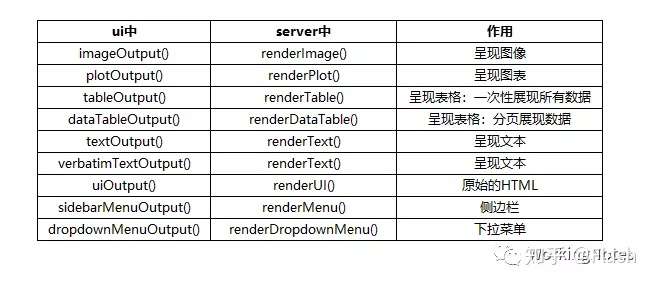
上表中最后4个输入项函数可以归为一类:控制型输入项,控制操作是否生效。有输入就有输出,输入项需要传给输出项,输出项都是成对出现的:在ui中使用Output,在serve中render与之对应,两者通过变量名对应。常用的有以下几对常用的输出项:
说明
以下所用到的app.R脚本按照标准的shinydashboard代码书写,谨记:侧边栏一般放置输入项以及菜单栏,主体中呈现输出部分,故输入项函数和菜单栏函数写在ui脚本dashboardSiderbar()中,输入项函数的输出项*Output()函数写在ui脚本dashboardBody()中,render*函数写在server脚本中与之对应。
library(shinydashboard)
  shinyApp(
    ui = dashboardPage(
      dashboardHeader(),
      dashboardSidebar(),
      dashboardBody()
    ),
    server = function(input, output) { }
  )

### 或者
library(shinydashboard)
header <- dashboardHeader()
side <- dashboardSidebar()
body <- dashboardBody()
shinyApp(
    ui = dashboardPage(
        header,
        side,
        body
    ),
    server = function(input, output) { }
)


selectInput输入项

以下拉菜单形式选择某个value。

library(shiny)
library(shinydashboard)
library(ggplot2)

ui <- dashboardPage(
  dashboardHeader(title = "Flash WorkingNotes"),
  dashboardSidebar(
    selectInput("Position", "The Type of Plot:",
                c("fill" = "fill",
                  "dodge" = "dodge",
                  "stack" = "stack"))),
  dashboardBody(plotOutput("Plot"))
)

server <- function(input, output) {
  set.seed(123)
  data = diamonds[sample(1:nrow(diamonds), 10000, replace = F), ]
  output$Plot <- renderPlot({
    ggplot(data, aes(x = price, fill = cut)) +
      geom_histogram(position = input$Position, bins = 30) +
      ggtitle("histogram") +
      theme(plot.title = element_text(hjust = 0.5)) + xlab("")
  })
}
shinyApp(ui, server)
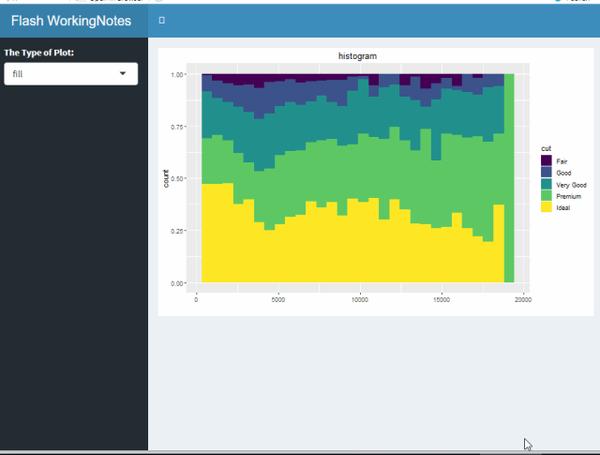
请留意上图代码中输入项selectInput函数书写位置以及输出函数plotOutput以及renderPlot位置,两者是通过“Plot”变量名对应的。上图主要实现选择不同参数fill、dodge和stack控制直方图的类型。
sliderInput输入项
滑动条形式选择某个数值,可以设置自动滑动按钮。
library(shiny)
library(shinydashboard)
library(ggplot2)
library(DT)

ui <- dashboardPage(
  dashboardHeader(title = "Flash WorkingNotes"),
  dashboardSidebar(
    sliderInput("obs", "Number of Data:",
                min = 0, max = 100, value = 2, animate = TRUE)),
  dashboardBody(dataTableOutput("Data"))
)

server <- function(input, output) {
  set.seed(123)
  data = diamonds[sample(1:nrow(diamonds), 10000, replace = F), ]

  output$Data <- renderDataTable({
    datatable(head(data,input$obs))
  })

}
shinyApp(ui, server)
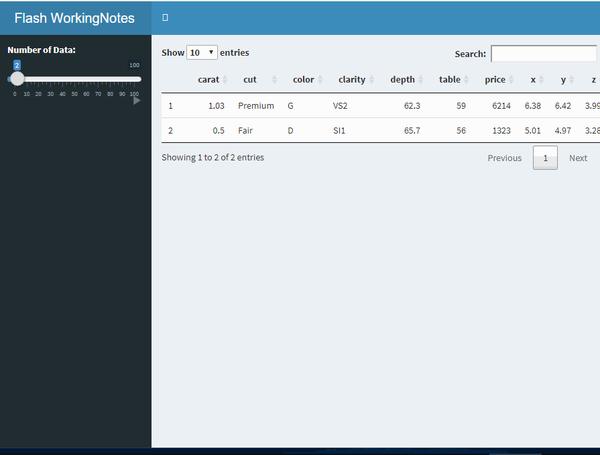
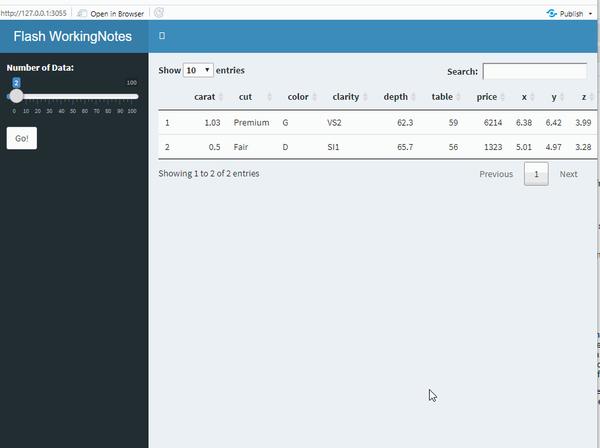
注意上图代码中输入项sliderInput函数书写位置以及输出函数dataTableOutput以及renderDataTable位置,两者是通过“Data”变量名对应的。上图通过滑动条控制展示数据的行数。
fileInput输入项
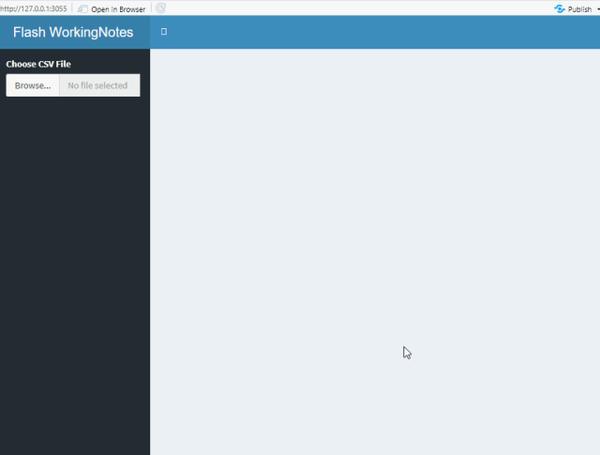
fileInput函数主要用于从本地上传数据。
library(shiny)
library(shinydashboard)
library(ggplot2)
library(DT)

ui <- dashboardPage(
  dashboardHeader(title = "Flash WorkingNotes"),
  dashboardSidebar(
    fileInput('file1', 'Choose CSV File',
              accept=c('text/csv', 'text/comma-separated-values,text/plain', '.csv'))),
  dashboardBody(dataTableOutput("Data"))
)
server <- function(input, output) {
  dataset <- reactive({
    inFile <- input$file1
    if (!is.null(inFile))
      read.csv(inFile$datapath, header = TRUE, sep= ",", stringsAsFactors = T)
  })

  output$Data <- renderDataTable({
    datatable(dataset())
  })

}
shinyApp(ui, server)
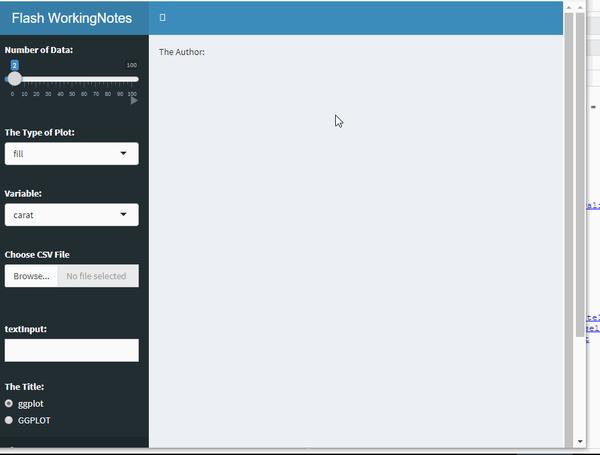
textInput输入项
用于交互式文本输入。
library(shiny)
library(shinydashboard)
library(ggplot2)
library(DT)
ui <- dashboardPage(
  dashboardHeader(title = "Flash WorkingNotes"),
  dashboardSidebar(
    textInput("text","textInput:")),
  dashboardBody(textOutput("Author"))
)
server <- function(input, output) {
  output$Author <- renderText({
    paste("The Author:", input$text)
  })
}
shinyApp(ui, server)
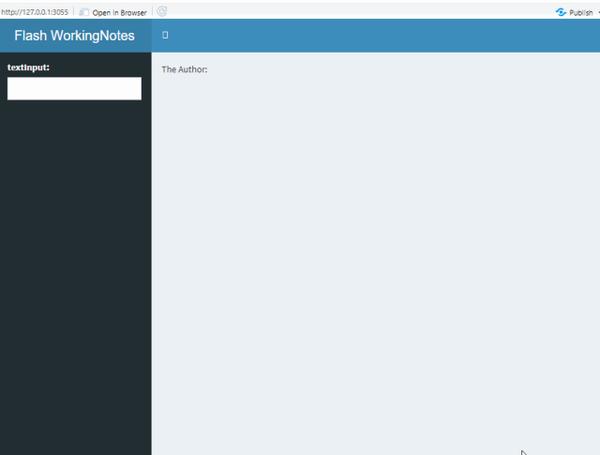
输入不同的作者名,主体部分发生相应的变化,textOutput函数与renderText函数通过“Author”字段对应。
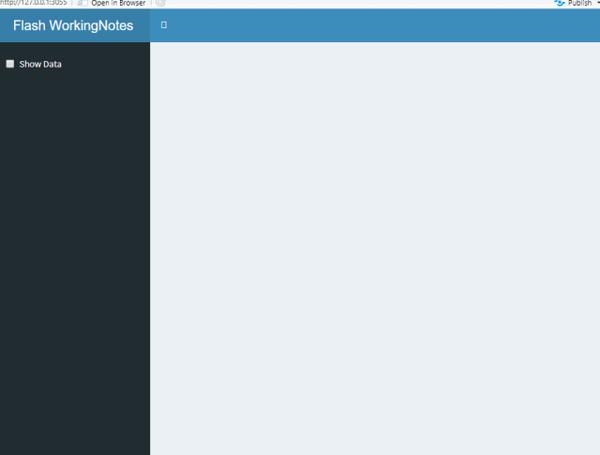
checkboxInpu输入项
用于控制是否展示内容,例如是否展示原数据、绘制图形的时候是否展示异常点等。
library(shiny)
library(shinydashboard)
library(ggplot2)
library(DT)
ui <- dashboardPage(
  dashboardHeader(title = "Flash WorkingNotes"),
  dashboardSidebar(
    checkboxInput("value", "Show Data", FALSE)),
  dashboardBody(textOutput("value"),
                 dataTableOutput("Data"))
)

server <- function(input, output) {
  set.seed(123)
  data = diamonds[sample(1:nrow(diamonds), 10000, replace = F), ]
    output$Data <- renderDataTable({
      if((!!input$value) == "TRUE") {
        datatable(data)
      }
    })
}
shinyApp(ui, server)
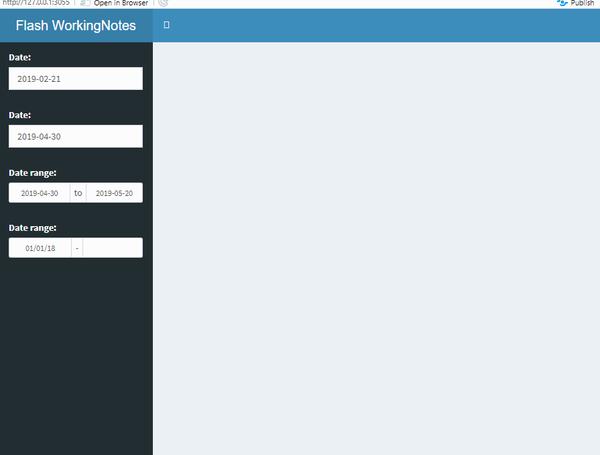
dateInput与dateRangeInput输入项
用于日期的选择,dateInput输入项是选择某个日期,dateRangeInput是选择日期范围。
library(shiny)
library(shinydashboard)
ui <- dashboardPage(
  dashboardHeader(title = "Flash WorkingNotes"),
  dashboardSidebar(
    dateInput("date1", "Date:", value = "2019-02-21"),
    dateInput("date4", "Date:", value = Sys.Date()-10),
    dateRangeInput("daterange4", "Date range:",
                   start = Sys.Date()-10,
                   end = Sys.Date()+10),
    dateRangeInput("daterange3", "Date range:",
                   start  = "2018-01-01",
                   end    = "2019-12-31",
                   min    = "2018-01-01",
                   max    = "2019-12-21",
                   format = "mm/dd/yy",
                   separator = " - ")),
  dashboardBody()
)

server <- function(input, output) {
}
shinyApp(ui, server)
downloadLink与downloadButton输入项
用于下载数据,两个输入项函数可以等价替换,downloadLink输入项函数显示的是一个下载链接,downloadButton输入项函数显示的是一个下载按钮。
library(shiny)
library(shinydashboard)
library(ggplot2)
library(DT)
ui <- dashboardPage(
  dashboardHeader(title = "Flash WorkingNotes"),
  dashboardSidebar(
    downloadLink('downloadData', 'Download', class = "A"),
    downloadButton('downloadData1', 'Download')
    ),
  dashboardBody(dataTableOutput("Data"))
)

server <- function(input, output) {
  set.seed(123)
  data = diamonds[sample(1:nrow(diamonds), 10000, replace = F), ]
  output$Data <- renderDataTable({
    datatable(data)
  })
  output$downloadData <- downloadHandler(
    filename = function() {
      paste('data-', Sys.Date(), '.csv', sep='')
    },
    content = function(con) {
      write.csv(data, con)
    }
  )
  output$downloadData1 <- downloadHandler(
    filename = function() {
      paste('data1-', Sys.Date(), '.csv', sep='')
    },
    content = function(con) {
      write.csv(data, con)
    }
  )
}

shinyApp(ui, server)
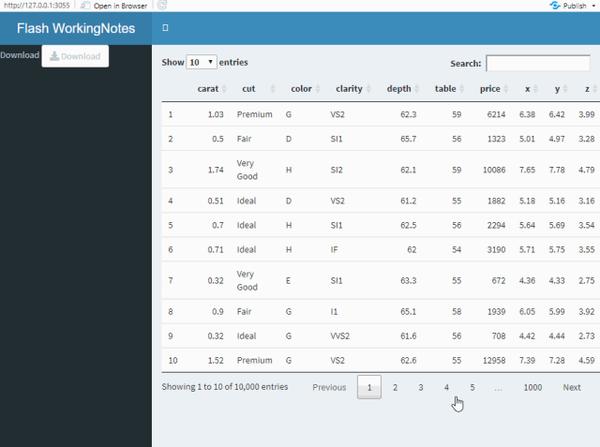
注意上图第一个是下载链接形式,第二个是下载按钮形式。
numericInput输入项
用于选择某个数字,可以设置“跳跃”的步长。
library(shiny)
library(shinydashboard)
library(ggplot2)
library(DT)
ui <- dashboardPage(
  dashboardHeader(title = "Flash WorkingNotes"),
  dashboardSidebar(
    numericInput("obs", "Number of Data:",
                min = 0, max = 100, value = 2, step = 2)),
  dashboardBody(dataTableOutput("Data"))
)

server <- function(input, output) {
  set.seed(123)
  data = diamonds[sample(1:nrow(diamonds), 10000, replace = F), ]

  output$Data <- renderDataTable({
    datatable(head(data,input$obs))
  })
}
shinyApp(ui, server)
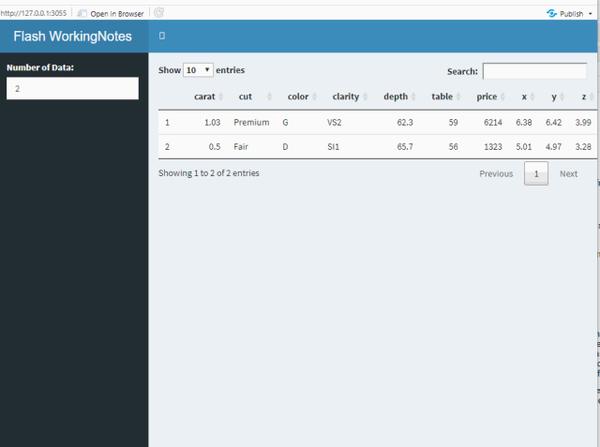
上图跳跃步长设置的为2.
helpText输入项
解释说明作用,见submitButton输入项函数。
varSelectInput输入项函数
用于获取数据源的列名。
library(shiny)
library(shinydashboard)
library(ggplot2)
library(DT)
ui <- dashboardPage(
  dashboardHeader(title = "Flash WorkingNotes"),
  dashboardSidebar(
    varSelectInput("variable", "variable:", diamonds)),
  dashboardBody(plotOutput("Plot"))
)

server <- function(input, output) {
  set.seed(123)
  data = diamonds[sample(1:nrow(diamonds), 10000, replace = F), ]
  output$Plot <- renderPlot({
    ggplot(data = data, aes(x = (!!!input$variable), y = price, colour = color)) +
      geom_point() +  ggtitle("scatter diagram") +
      theme(plot.title = element_text(hjust = 0.5))
  })

}
shinyApp(ui, server)
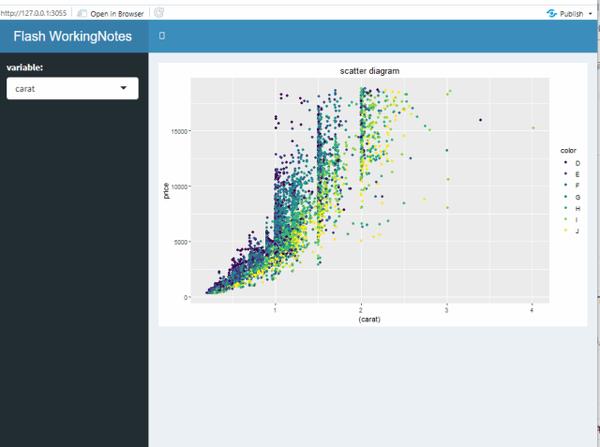
这里有一个小技巧,使用三个“!!!”(!!!input$variabl)将带有引号的“carat”字段转化为不带引号的carat字段,绘制ggplot图以及建模的时候经常用到。
actionLink与actionButton输入项
两个输入项函数作用相同,用于控制操作是否有效,可以等价替换。
library(shiny)
library(shinydashboard)
library(ggplot2)
library(DT)
ui <- dashboardPage(
  dashboardHeader(title = "Flash WorkingNotes"),
  dashboardSidebar(
    sliderInput("obs", "Number of Data:",
                min = 0, max = 100, value = 2),
    actionButton("goButton", "Go!")),
  dashboardBody(dataTableOutput("Data"))
)

server <- function(input, output) {
  set.seed(123)
  data = diamonds[sample(1:nrow(diamonds), 10000, replace = F), ]

  output$Data <- renderDataTable({
    input$goButton
    data <- isolate(head(data,input$obs))
    datatable(data)
  })
}
shinyApp(ui, server)
上图,当滑动滑动条的时候,界面主体部分内容不再发生变化,当点击“Go”按钮的时候,主体部分才发生变化。
passwordInput输入项
当输入密码正确的时候才展示相关内容。
library(shiny)
library(shinydashboard)
library(ggplot2)
library(DT)
ui <- dashboardPage(
  dashboardHeader(title = "Flash WorkingNotes"),
  dashboardSidebar(
    sliderInput("obs", "Number of Data:",
                min = 0, max = 100, value = 2),
    passwordInput("password", "Author:")),
  dashboardBody(dataTableOutput("Data"))
)

server <- function(input, output) {
  set.seed(123)
  data = diamonds[sample(1:nrow(diamonds), 10000, replace = F), ]

  output$Data <- renderDataTable({
    if (input$password == "Flash") {
      datatable(data)
    }
  })
}
shinyApp(ui, server)
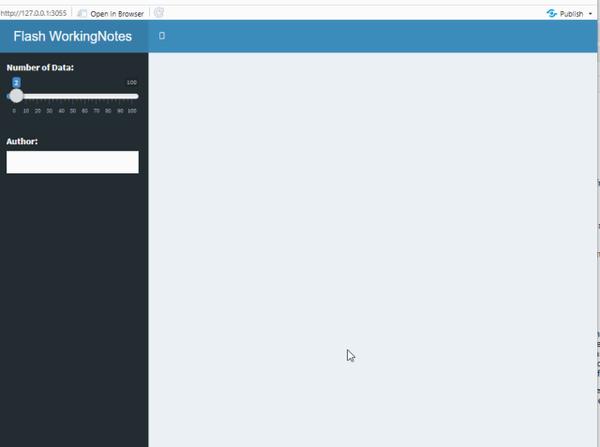
上图的正确密码为“Flash”,第一次输入“123”的时候,密码错误,不展示内容;当第二次输入密码“Flash”的时候,密码正确,展示内容。
submitButton输入项
类似于actionButton输入项与passwordInput输入项,点击按钮时候才更新主体内容。
library(shiny)
library(shinydashboard)
library(ggplot2)
library(DT)
ui <- dashboardPage(
  dashboardHeader(title = "Flash WorkingNotes"),
  dashboardSidebar(
    sliderInput("obs", "Number of Data:",
                min = 0, max = 100, value = 2),
    submitButton("Update Data", icon("refresh")),

    helpText("click the button above, update the date:")),
  dashboardBody(dataTableOutput("Data"))
)

server <- function(input, output) {
  set.seed(123)
  data = diamonds[sample(1:nrow(diamonds), 10000, replace = F), ]

  output$Data <- renderDataTable({
      datatable(head(data, input$obs))
  })
}
shinyApp(ui, server)
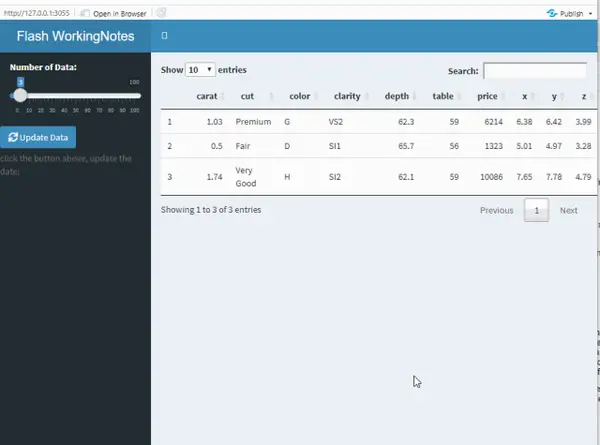
上图当滑动滑动条的时候,主体数据没有发生变化,点击“Update Data”按钮之后,主体部门数据发生了相应的变化。
总结
本部分简单介绍常用的几个侧边栏的输入项函数。当你做交互式界面的时候,需要用到几个输入项函数时,累加一起使用即可。重点注意输入项函数写在ui中dashboardSidebar函数中,有输入项函数就有输出项函数与之对应,输出项函数成对出现(Output函数和render函数),Output函数 写在ui中的dashboardBody函数中,render函数写在server中。