
前言
这一节开始介绍一下仪表盘的主体(body)部分。主体部分可以包括任何内容,图形、文本、表格等。前面的例子都是每个界面包含一个对象(文本、图形、表格等),如果想搭建一个更具有层次性更美观的仪表盘,需要了解一下如何对主体进行布局以及如何使用一些box函数。 【R语言】shinydashboard系列一:标题栏 【R语言】shinydashboard系列二:侧边栏–输入项 【R语言】shinydashboard系列三:侧边栏–菜单项
布局
主体的布局使用Bootstrapgrid layout system(Bootstrap网格系统),可以将主体划分为12个列宽相等的区域以及任意可变高度的行。主体布局有3种布局:基于行的布局(Row_based Layout)、基于列的布局(column_based Layout)以及混合布局(Mixed row and column layout),使用fluidRow()函数和column()函数创建3种类型的布局。
之前介绍过,输入项函数通过改变输入参数改变界面所呈现的内容,菜单项函数放在侧边栏,一般情况下输入项函数可以放在侧边栏(前面部分介绍的),也可以将输入项函数部署在主体中。简单解释一下3种布局(非官方,个人认为的):
基于行的布局:代码中多个fluidRow()函数,每一个fluidRow()构成一行,即为一个整体,每行整体中元素列宽之和为12。
基于列的布局:代码中有一个fluidRow()函数和若干个column()构成。狭义地,只有一个整体,fluidRow()构成的行整体,行整体下多个column构成的列整体;广义地,多个列整体,由每一个column()函数构成的列整体,列整体内元素的高度会随着呈现的内容的变化发生相应的变化。
混合布局:基于行的布局和基于列的布局的混搭。
基于行的布局
library(shiny)
library(shinydashboard)
library(ggplot2)
body <- dashboardBody(
            fluidRow(
              box(selectInput("Position", "The Type of Plot:",
                      c("fill" = "fill","dodge" = "dodge","stack" = "stack")),width = 2),
              box(radioButtons("Title","The Title:",choices = c("ggplot","GGPLOT")),width = 2),
              box(plotOutput("Plot"), width = 8)),
            fluidRow(
              box(sliderInput("obs", "Number of Data:", min = 0, max = 100, value = 2, animate = TRUE),width = 4),
              box(dataTableOutput("Data"), width = 8))
            )

ui <- dashboardPage(
  dashboardHeader(title = "Flash WorkingNotes"),
  dashboardSidebar(),
  body
)

server <- function(input, output) {
  set.seed(123)
  data = diamonds[sample(1:nrow(diamonds), 10000, replace = F), ]
  output$Plot <- renderPlot({
    ggplot(data, aes(x = price, fill = cut)) +
      geom_histogram(position = input$Position, bins = 30) +
      ggtitle(input$Title) +
      theme(plot.title = element_text(hjust = 0.5)) + xlab("")
  })
  output$Data <- renderDataTable({
    head(data, input$obs)
  })
}
shinyApp(ui, server)
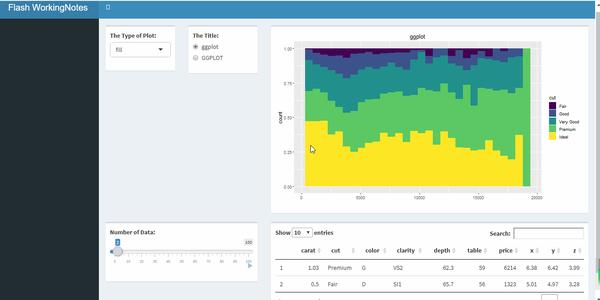
上述动态图为基于行的布局,有两个fluidRow()函数,所以布局中创建了两个行整体:一个行整体是绘制不同类型的直方图,包含直方图类型参数输入项、直方图标题输入项以及直方图输出项3个元素。另一个行整体是源数据,包含滑动条输入项、数据输出项。在box()函数中可以使用width = n设置整体中元素的列宽,可以使用height = n,将每个整体内的元素的高度设为相同。
基于列的布局
library(shiny)
library(shinydashboard)
library(ggplot2)
library(DT)

body <- dashboardBody(
  fluidRow(
    column(width = 5,
      box(selectInput("Position", "The Type of Plot:",
                      c("fill" = "fill","dodge" = "dodge","stack" = "stack")),width = NULL),
      box(radioButtons("Title","The Title:",choices = c("ggplot","GGPLOT")),width = NULL),
      box(plotOutput("Plot"), width = NULL)),
    column(width = 7,
      box(sliderInput("obs", "Number of Data:", min = 0, max = 100, value = 2, animate = TRUE),width = NULL),
      box(dataTableOutput("Data"), width = NULL)),
      box(verbatimTextOutput("Summary"), width = 7))
)
ui <- dashboardPage(
  dashboardHeader(title = "Flash WorkingNotes"),
  dashboardSidebar(),
  body
)

server <- function(input, output) {
  set.seed(123)
  data = diamonds[sample(1:nrow(diamonds), 10000, replace = F), ]
  output$Plot <- renderPlot({
    ggplot(data, aes(x = price, fill = cut)) +
      geom_histogram(position = input$Position, bins = 30) +
      ggtitle(input$Title) +
      theme(plot.title = element_text(hjust = 0.5)) + xlab("")
  })
  output$Data <- renderDataTable({
    head(data, input$obs)
  })
  output$Summary <- renderPrint({
    str(data)
  })
}
shinyApp(ui, server)

上面动态图为基于列的布局,有一个fluidRow函数和两个column函数构成。从广义上来说,有两个列整体,第一个列整体为绘制不同类型的直方图:包含直方图类型参数输入项、直方图标题输入项以及直方图输出项;另一个列整体包含滑动条输入项、源数据和数据类型。留意滑动条的变动,数据源的高度发生着相应的变化。一般情况下,column内的每一个box()的width = NULL。
混合布局
混合布局是最常用的,由基于行的布局和基于列的布局的混搭而成。
library(shiny)
library(shinydashboard)
library(ggplot2)
body <- dashboardBody(
  fluidRow(
    box(selectInput("Position", "The Type of Plot:",
                    c("fill" = "fill","dodge" = "dodge","stack" = "stack")),width = 4),
    box(radioButtons("Title","The Title:",choices = c("ggplot","GGPLOT")),width = 4),
    box(sliderInput("obs", "Number of Data:", min = 0, max = 100, value = 2, animate = TRUE),width = 4)
    ),
  fluidRow(
    column(width = 12,box(plotOutput("Plot"), width = NULL)),
    column(width = 12,box(dataTableOutput("Data"), width = NULL)))
)

ui <- dashboardPage(
  dashboardHeader(title = "Flash WorkingNotes"),
  dashboardSidebar(),
  body
)
server <- function(input, output) {
  set.seed(123)
  data = diamonds[sample(1:nrow(diamonds), 10000, replace = F), ]
  output$Plot <- renderPlot({
    ggplot(data, aes(x = price, fill = cut)) +
      geom_histogram(position = input$Position, bins = 30) +
      ggtitle(input$Title) +
      theme(plot.title = element_text(hjust = 0.5)) + xlab("")
  })
  output$Data <- renderDataTable({
    head(data, input$obs)
  })
}
shinyApp(ui, server)
上述动态图中有两个fluidRow()函数和两个column()函数,第一个行整体由三个输入项函数构成,第二个行整体由图形列整体和数据源列整体组成。
总结
主体布局有基于行的布局、基于列的布局以及混合布局3种,其中混合布局是最常用到的,3种布局由fluidRow()函数和column()函数搭建。