
前言
承接系列四,这一节介绍一下主体中的4种box函数。顾名思义,box函数是在主体中创建一些对象框,而对象框内可以包含任何内容。
【R语言】shinydashboard系列二:侧边栏–输入项 【R语言】shinydashboard系列三:侧边栏–菜单项 【R语言】shinydashboard系列四:主体布局
四种box函数
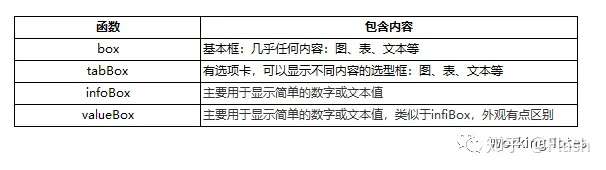
下面结合之前侧边栏以及主体布局简单介绍一下4种box函数。
box对象框
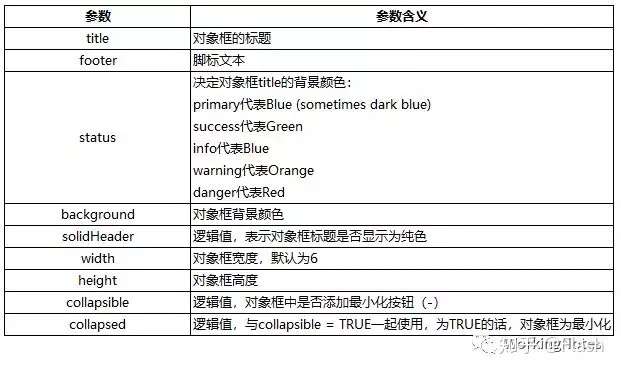
box对象框为基本对象框,用到的最多。函数为box(),函数中有几个常用的参数:
代码
library(shiny)
library(shinydashboard)
library(ggplot2)

ui <- dashboardPage(
  dashboardHeader(title = "WorkingNotes:Box"),

  dashboardSidebar(
    sidebarMenu(
    menuItem("Plot1", tabName = "Plot1", icon = icon("dashboard")),
    menuItem("Plot2", tabName = "Plot2", icon = icon("dashboard")),
    menuItem("Plot3", tabName = "Plot3", icon = icon("dashboard")))),
  dashboardBody(
    tabItems(
      tabItem(tabName = "Plot1",
        fluidPage(
          box("仅仅设置宽度为6"),
          box("在上图基础上加上对象框title的背景颜色为red")
        ),
        fluidPage(
          box(plotOutput("Plot"), width = 6),
          box(plotOutput("Plot1"), status = "danger", width = 6))),
      tabItem(tabName = "Plot2",
              fluidPage(
                box("在上图基础上加上背景颜色为green"),
                box("在上图基础上加上最小化按钮")
              ),
              fluidPage(
                box(plotOutput("Plot2"), status = "success",background = "green", width = 6),
                box(plotOutput("Plot3"), status = "success",background = "green", collapsible = TRUE, width = 6))),

      tabItem(tabName = "Plot3",
              fluidPage(
                box("在上图基础上加collapsed = TRUE,图形已经最小化"),
                box("在上图基础上加上标题")
              ),
              fluidPage(
                box(plotOutput("Plot4"),  status = "success", background = "green",collapsible = TRUE,
                    collapsed = TRUE,width = 6),
                box(plotOutput("Plot5"), status = "success", background = "green", collapsible = TRUE,
                    collapsed = TRUE,title = "histogram", width = 6)))
          ))
)

server <- function(input, output) {
  set.seed(123)
  data = diamonds[sample(1:nrow(diamonds), 10000, replace = F), ]
  p <- renderPlot({
    ggplot(data, aes(x = price, fill = cut)) +
      geom_histogram(bins = 30) +
      ggtitle("geom_histogram") +
      theme(plot.title = element_text(hjust = 0.5)) + xlab("")
  })
  output$Plot <- p
  output$Plot1 <- p
  output$Plot2 <- p
  output$Plot3 <- p
  output$Plot4 <- p
  output$Plot5 <- p
}
shinyApp(ui, server)
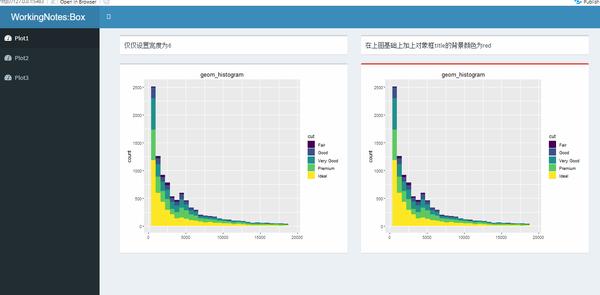
上述代码中:侧边栏创建3个菜单栏,每一个菜单栏对应的主体界面布局为基于行的主体布局,每一个界面的第一个行整体用于解释第二个行整体。
tabBox对象框
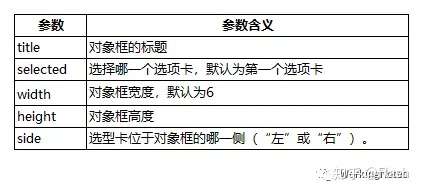
使用tabBox()函数创建具有选项卡的对象框,函数内使用tabPanel()创建不同的选项卡,tabPanel()内添加输出对象。
library(shiny)
library(shinydashboard)
library(ggplot2)
library(DT)
sider <- dashboardSidebar(
    sidebarMenu(
      menuItem("tabbox1", tabName = "tabbox1", icon = icon("dashboard")),
      menuItem("tabbox2", tabName = "tabbox2", icon = icon("dashboard")),
      menuItem("tabbox3", tabName = "tabbox3", icon = icon("dashboard")))
    )

body <- dashboardBody(
  tabItems(
  ###tabBox标题为tabbox1,宽度为12,高度为500px,其他参数为默认
    tabItem(tabName = "tabbox1",
            fluidRow(
              tabBox(title = "tabbox1",height = "500px", width = 12,
                tabPanel("plot", plotOutput("Plot")),
                tabPanel("data", dataTableOutput("Data")))
            )
  ),

  tabItem(tabName = "tabbox2",
            fluidRow(
            ###selected = "data",故data为活跃选项卡,side="right",选项卡呈现在右边
              tabBox(title = "tabbox2",
                side = "right", height = "500px", width = 12,
                selected = "data",
                tabPanel("plot", plotOutput("Plot1")),
                tabPanel("data", dataTableOutput("Data1"))))
          ),

  tabItem(tabName = "tabbox3",
          fluidRow(
          ###selected="plot",故plot选项卡为活跃
            tabBox(height = "500px", width = 12,selected = "plot",
              title = tagList(shiny::icon("gear"), "tabbox3"),
              tabPanel("data", dataTableOutput("Data2")),
              tabPanel("plot", plotOutput("Plot2"))))
          ))
  )

ui <- dashboardPage(
  dashboardHeader(title = "WorkingNotes:tabBox"),
  sider,
  body
)

server = function(input, output) {
  set.seed(123)
  data = diamonds[sample(1:nrow(diamonds), 10000, replace = F), ]

  p <- renderPlot({
    ggplot(data, aes(x = price, fill = cut)) +
      geom_histogram(position = "dodge", bins = 30) +
      ggtitle("geom_histogram") +
      theme(plot.title = element_text(hjust = 0.5)) + xlab("")
  })

  d <- renderDataTable({
    datatable(data)
  })
  output$Plot <- p
  output$Plot1 <- p
  output$Plot2 <- p
  output$Data <- d
  output$Data1 <- d
  output$Data2 <- d

}
shinyApp(ui, server)
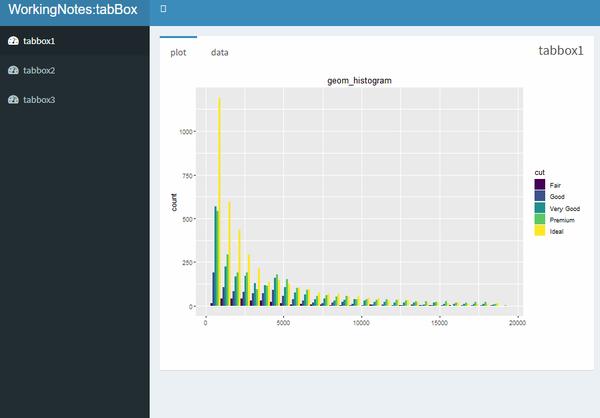
上图侧边栏创建3个菜单栏,三个菜单栏对应的主体界面都是基于行的布局。第一个菜单栏 的tabBox设置标题为“tabbox1”,其他参数为默认值,故选项卡位于左侧,第一个选项卡plot为激活状态;第二个菜单栏主体设置side = “right“,故选项卡位置位于右侧,且设置selected = “data“,故data选项卡为激活状态;第三个菜单栏设置一下title,设置selected = “plot“,故plot选项卡为激活状态。
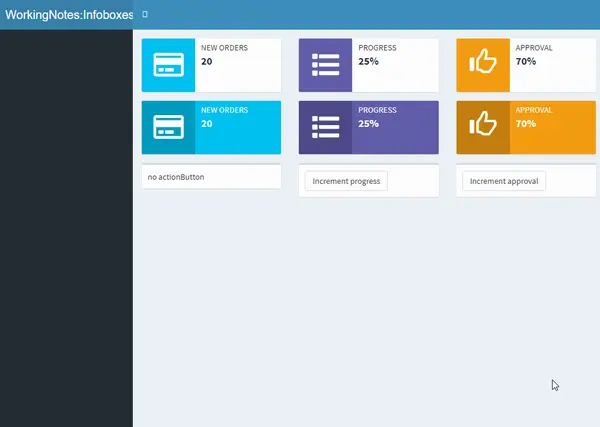
infoBox对象框 infoBox对象框和valueBox两者功能类似,而且用到的不多,故这里简单介绍一下。infoBox()函数中有一个逻辑参数fill决定对象框是否为纯色,有静态infoBox,使用infoBox()函数创建,有动态infoBox,使用成对的infoBoxouput()函数和激活函数renderInfoBox()创建。
library(shinydashboard)

ui <- dashboardPage(
  dashboardHeader(title = "WorkingNotes:Infoboxes"),
  dashboardSidebar(),
  dashboardBody(
    ##fill为默认,非纯色填充
    fluidRow(
      # 静态infoBox
      infoBox("New Orders", 10 * 2, icon = icon("credit-card")),
      # 动态infoBoxes
      infoBoxOutput("progressBox"),
      infoBoxOutput("approvalBox")
    ),

    ##fill为TRue,纯色填充
    fluidRow(
      infoBox("New Orders", 10 * 2, icon = icon("credit-card"), fill = TRUE),
      infoBoxOutput("progressBox2"),
      infoBoxOutput("approvalBox2")
    ),

    fluidRow(
      ##点击按钮,增加值
      box(width = 4, "no actionButton"),
      box(width = 4, actionButton("count", "Increment progress")),
      box(width = 4, actionButton("count1", "Increment approval"))
    )
  )
)

server <- function(input, output) {
  output$progressBox <- renderInfoBox({
    infoBox(
      "Progress", paste0(25 + input$count, "%"), icon = icon("list"),
      color = "purple"
    )
  })
  output$approvalBox <- renderInfoBox({
    infoBox(
      "Approval", paste0(70 + input$count1, "%"), icon = icon("thumbs-up", lib = "glyphicon"),
      color = "yellow"
    )
  })

  ##与上面显示一样,唯一区别是实填充
  output$progressBox2 <- renderInfoBox({
    infoBox(
      "Progress", paste0(25 + input$count, "%"), icon = icon("list"),
      color = "purple", fill = TRUE
    )
  })
  output$approvalBox2 <- renderInfoBox({
    infoBox(
      "Approval", paste0(70 + input$count1, "%"), icon = icon("thumbs-up", lib = "glyphicon"),
      color = "yellow", fill = TRUE
    )
  })
}

shinyApp(ui, server)
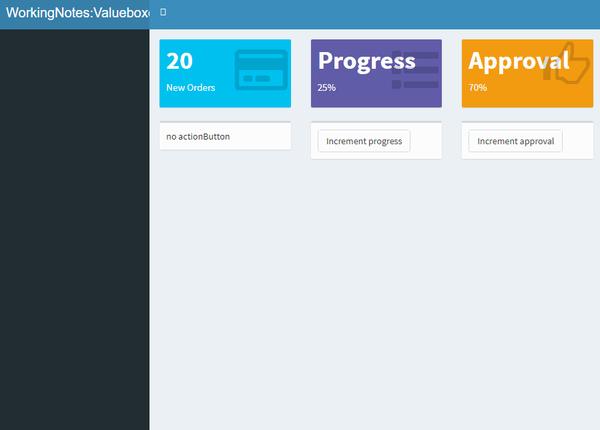
valueBox对象框
library(shinydashboard)

ui <- dashboardPage(
  dashboardHeader(title = "WorkingNotes:Valueboxes"),
  dashboardSidebar(),
  dashboardBody(
    fluidRow(
      ##静态valuebox
      valueBox(10 * 2, "New Orders", icon = icon("credit-card")),

      ##动态valuebox
      valueBoxOutput("progressBox"),

      valueBoxOutput("approvalBox")
    ),
    fluidRow(
      ##点击按钮,增加值
      box(width = 4, "no actionButton"),
      box(width = 4, actionButton("count", "Increment progress")),
      box(width = 4, actionButton("count1", "Increment approval"))
    )
  )
)

server <- function(input, output) {
  output$progressBox <- renderValueBox({
    valueBox(
      "Progress", paste0(25 + input$count, "%"), icon = icon("list"),
      color = "purple"
    )
  })

  output$approvalBox <- renderValueBox({
    valueBox(
      "Approval", paste0(70 + input$count1, "%"), icon = icon("thumbs-up", lib = "glyphicon"),
      color = "yellow"
    )
  })
}

shinyApp(ui, server)
总结
到这里将shinydashborad的标题栏、侧边栏以及主体简单的介绍一下,可以开发出自己的shinyapp了。下面章节将介绍如何将shinyapp共享到服务器上以及对shinyapp加密,输入账号和密码才能访问shinyapp。