
前言
在本地上编写好一个shinyapp之后,让别人也能使用自己的应用一般有两种方法:提供源代码以及网页工具。提供源代码的话,要求使用者安装R语言,适合一些小型应用;网页工具,以网页形式提供给别人使用,是最常见也是最友好的方式,提供一个网址即可。有时候,开发的应用只对特定人群使用,需要对网页就行加密,输入账号名和密码之后才能访问。故这一节介绍如何部署自己的shiayapp以及对其加密,主要介绍如何加密。
【R语言】shinydashboard系列一:标题栏 【R语言】shinydashboard系列二:侧边栏–输入项 【R语言】shinydashboard系列三:侧边栏–菜单项 【R语言】shinydashboard系列四:主体布局 【R语言】shinydashboard系列五:主体Boxs
使用http://shinyapps.io管理shiny应用
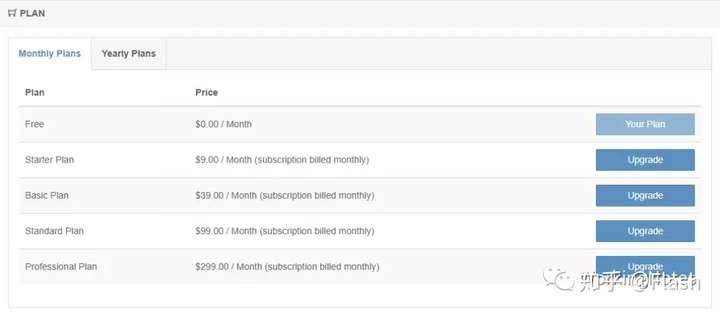
http://shinyapps.io是一个管理shiny web应用程序的平台,可以将shiny应用部署到云端。使用http://shinyapps.io分享自己的shiny应用,主要是因为免费,免费,免费!!!不需要一台服务器,也不需要花时间去配置。当然,天下没有绝对的免费午餐,既然免费,也存在一些缺点:不能放太多的应用,免费的好像是5个应用,不能对shiny应用加密;若是土豪,可以使用下面几个付费版本,功能更加齐全。
这里不多说,使用邮箱和密码就可以创建一个http://shinyapps.io账户。shinyapps网址:http://www.shinyapps.io/。
配置与部署
https://docs.rstudio.com/shinyapps.io/官网网站,也是就注册登录之后help文档,配置起来很简单,这里不再介绍。
如何部署
首先在Rstudio中你的http://shinyapps.io的Tokens,如何找到你的Tokens?见下图:
在Rstudio中运行tokens:
library(rsconnect)
rsconnect::setAccountInfo(name='dzfamily',
                          token='B9400B841BDE1ABAA57EE68546379B2B',
                          secret='<SECRET>')
点击页面的”Show Secret”即可以得到完整的secret。
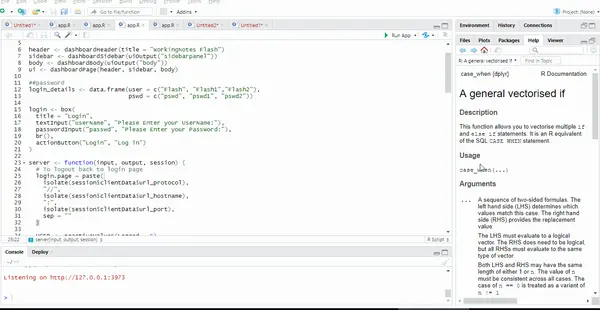
接着运行你的在Rstudio中运行你的app程序代码,点击发布即可:
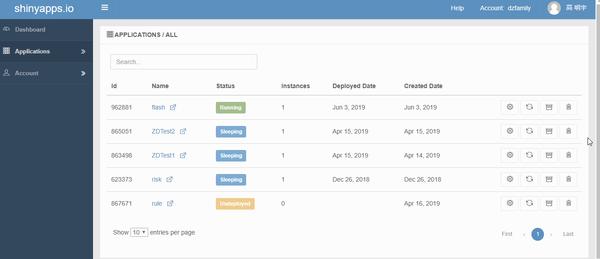
等待左下角的“Deploy”小圈圈转完就会自动跳到网页版,部署成功。
shiny应用加密 使用免费版本的http://shinyapps.io分享自己shiny应用的时候,没有加密功能,也就是说,任何人都可以查看和使用你的shiny应用,如果你的shiny应用中涉及到一些数据之类的,就涉及到安全问题了。因此,在编写shiny应用的时候,可以对其网页加密,使用者输入账户名和密码才能访问你的应用。 这里没有太多需要讲解的,这里我提供一个万能的模板,你需要加密的时候只需要将你的侧边栏函数写在代码中的output$sidebarpanel(),主体函数写在output$body即可。
library(shiny)
library(shinydashboard)
library(ggplot2)
library(DT)
header <- dashboardHeader(title = "WorkingNotes Flash")
sidebar <- dashboardSidebar(uiOutput("sidebarpanel"))
body <- dashboardBody(uiOutput("body"))
ui <- dashboardPage(header, sidebar, body)
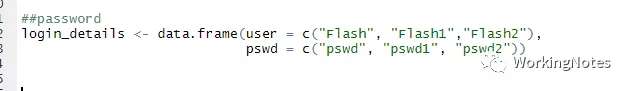
##password
login_details <- data.frame(user = c("Flash", "Flash1","Flash2"),
pswd = c("pswd", "pswd1", "pswd2"))
login <- box(
title = "Login",
textInput("userName", "Please Enter your UserName:"),
passwordInput("passwd", "Please Enter your PassWord:"),
br(),
actionButton("Login", "Log in")
)
server <- function(input, output, session) {
# To logout back to login page
login.page = paste(
isolate(session$clientData$url_protocol),
"//",
isolate(session$clientData$url_hostname),
":",
isolate(session$clientData$url_port),
sep = ""
)
USER <- reactiveValues(Logged = F)
observe({
if (USER$Logged == FALSE) {
if (!is.null(input$Login)) {
if (input$Login > 0) {
Username <- isolate(input$userName)
Password <- isolate(input$passwd)
Id.username <- which(login_details$user == Username)
Id.password <- which(login_details$pswd == Password)
if (length(Id.username) > 0 & length(Id.password) > 0){
if (Id.username == Id.password) {
USER$Logged <- TRUE
}
}
}
}
}
})
output$sidebarpanel <- renderUI({
if (USER$Logged == TRUE) {
div(
sidebarUserPanel(
paste("User:",isolate(input$userName)),
subtitle = a(icon("user"), "Logout", href = login.page)
)
###write your input,like dashboardSidebar
)
}
})
output$body <- renderUI({
if (USER$Logged == TRUE) {
##write your oupte, body
} else {
dashboardBody(login)
}
})
}
shinyApp(ui, server)
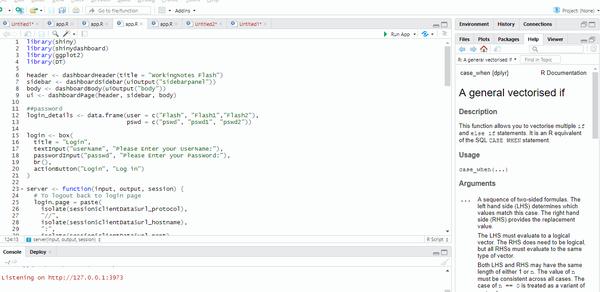
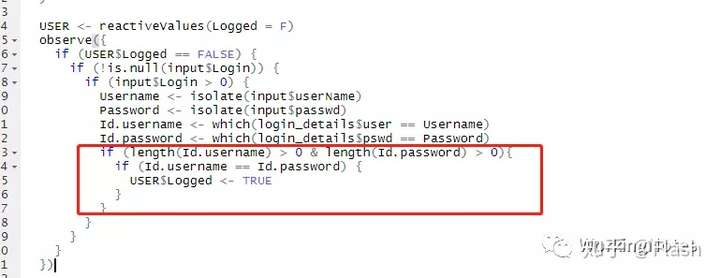
代码中数据框login_details 是账号和密码,下图就是关键代码,判断输入的账号和密码是否正确。
案例
我们在上面万能模板中加入需要展示的内容代码:
library(shiny)
library(shinydashboard)
library(ggplot2)
library(DT)

header <- dashboardHeader(title = "WorkingNotes Flash")
sidebar <- dashboardSidebar(uiOutput("sidebarpanel"))
body <- dashboardBody(uiOutput("body"))
ui <- dashboardPage(header, sidebar, body)

##password
login_details <- data.frame(user = c("Flash", "Flash1","Flash2"),
                            pswd = c("pswd", "pswd1", "pswd2"))

login <- box(
  title = "Login",
  textInput("userName", "Please Enter your UserName:"),
  passwordInput("passwd", "Please Enter your PassWord:"),
  br(),
  actionButton("Login", "Log in")
)

server <- function(input, output, session) {
  # To logout back to login page
  login.page = paste(
    isolate(session$clientData$url_protocol),
    "//",
    isolate(session$clientData$url_hostname),
    ":",
    isolate(session$clientData$url_port),
    sep = ""
  )

  USER <- reactiveValues(Logged = F)
  observe({
    if (USER$Logged == FALSE) {
      if (!is.null(input$Login)) {
        if (input$Login > 0) {
          Username <- isolate(input$userName)
          Password <- isolate(input$passwd)
          Id.username <- which(login_details$user == Username)
          Id.password <- which(login_details$pswd == Password)
          if (length(Id.username) > 0 & length(Id.password) > 0){
            if (Id.username == Id.password) {
              USER$Logged <- TRUE
            }
          }
        }
      }
    }
  })

  output$sidebarpanel <- renderUI({
    if (USER$Logged == TRUE) {
      div(
        sidebarUserPanel(
          paste("User:",isolate(input$userName)),
          subtitle = a(icon("user"), "Logout", href = login.page)
        ),
        sliderInput("obs", "Number of Data:",min = 0, max = 100, value = 2, animate = TRUE),
        selectInput("Position", "The Type of Plot:",c("fill" = "fill","dodge" = "dodge","stack" = "stack")),
        varSelectInput("Variable", "Variable:", diamonds),
        radioButtons("Title","The Title:",choices = c("ggplot","GGPLOT")),

        sidebarMenu(
          menuItem("Data", tabName = "Data", icon = icon("dashboard")),
          menuItem("Plot", tabName = "Plot", icon = icon("bar-chart-o")),
          menuItem("Plot1", tabName = "Plot1", icon = icon("bar-chart-o")))
      )
    }
  })

  data <- reactive({
    set.seed(123)
    diamonds[sample(1:nrow(diamonds), 10000, replace = F), ]
  })

  output$body <- renderUI({
    if (USER$Logged == TRUE) {
      tabItems(
        # First tab content
        tabItem(
          tabName = "Data",
          box(title = "the data", collapsible = TRUE,
              width = 12,height = 540, solidHeader = TRUE, status = "primary",
              output$Data <- renderDataTable({
                datatable(head(data(), input$obs))
              }))
        ),

        tabItem(
          tabName = "Plot",
          box(title = "the plot of histogram", width = 12, solidHeader = T,
              status = "primary",
              output$Plot <- renderPlot({
                ggplot(data(), aes(x = price, fill = cut)) +
                  geom_histogram(position = input$Position, bins = 30) +
                  ggtitle(input$Title) +
                  theme(plot.title = element_text(hjust = 0.5)) + xlab("")
              }))
        ),

        tabItem(
          tabName = "Plot1",

          box(title = "the plot of scatter", width = 12, solidHeader = T,
              status = "primary",
              output$Plot1 <- renderPlot({
                ggplot(data = data(), aes(x = (!!!input$Variable), y = price, colour = color)) +
                  geom_point() +  ggtitle("scatter diagram") +
                  theme(plot.title = element_text(hjust = 0.5))
              })))
      )
    } else {
      dashboardBody(login)
    }
  })
}
shinyApp(ui, server)
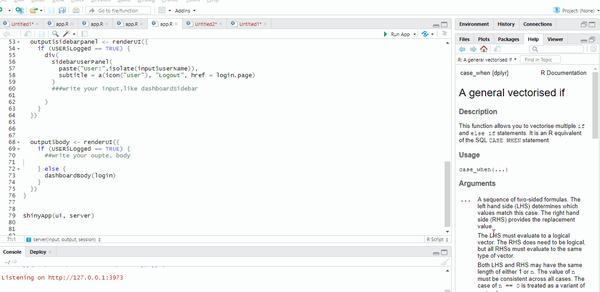
注意代码中侧边栏函数以及主体函数书写的位置。如果你想对你的shiny app加密,只需要将你app应用的R代码写到我提供的万能模板中即可,然后发布部署到shinyapp服务器上,别人就就可以通过网页输入账号和密码访问你的app应用了。上面的部署应用的网址:https://dzfamily.shinyapps.io/WorkingNotes/,点击之后输入账号和密码就可以访问应用了。密码为下面对应的任意一组:
总结
到这里,有关R语言的shinydsahboard系列内容全部介绍完了,这里我只是抛转引入,有问题欢迎随时交流哈,互相学习,共同进步呀。如果每周汇报相同的工作内容,何不尝试一下写一下shinyapp,每次只需要更新数据源呀。